Survey status Report
Overview
The Survey Status Report is essential for tracking and analysing survey distributions. This report helps to identify pending and completed surveys, monitor responses from specific departments, and understand the most frequently answered survey questions.
To configure a Survey Status Report, follow these steps:
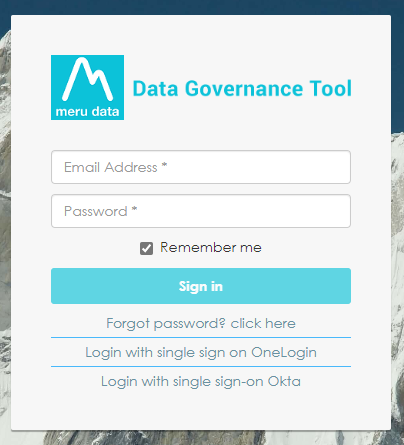
Sign into your Data Governance Tool account.
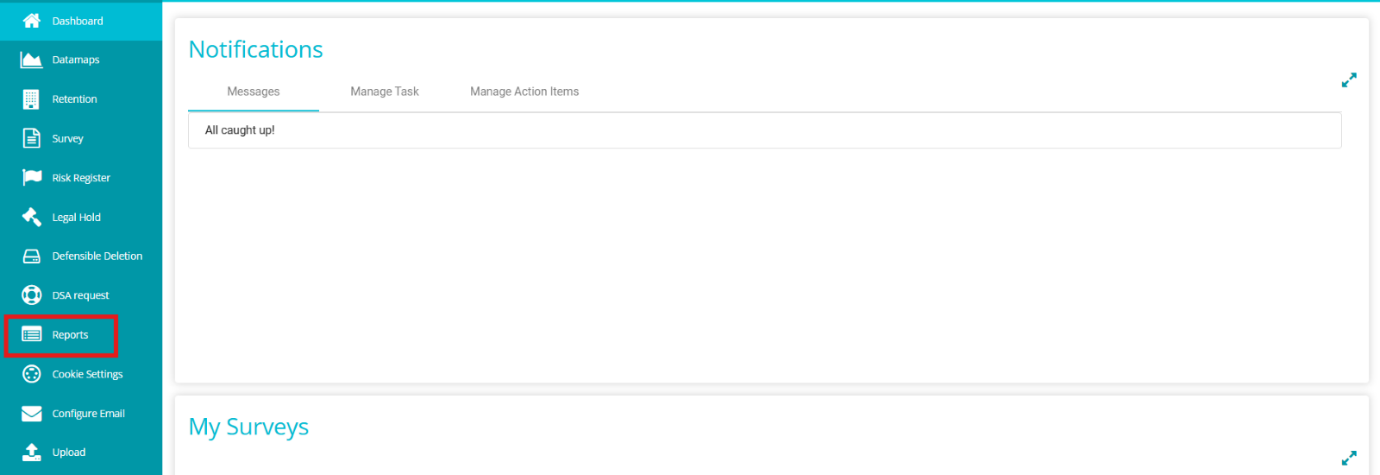
Click on the hamburger
 icon to open the menu.
 Select 'Reports' from the menu.
Click on the
 button on the screen.
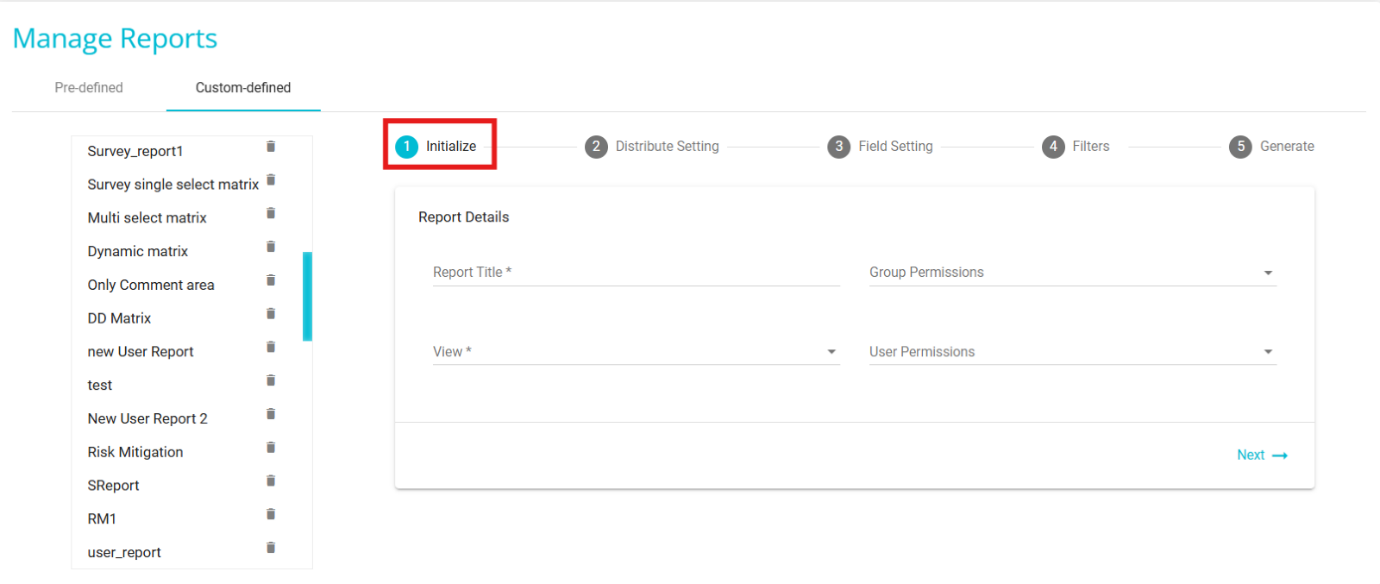
 From the Manage Reports page, click on Custom-Defined.
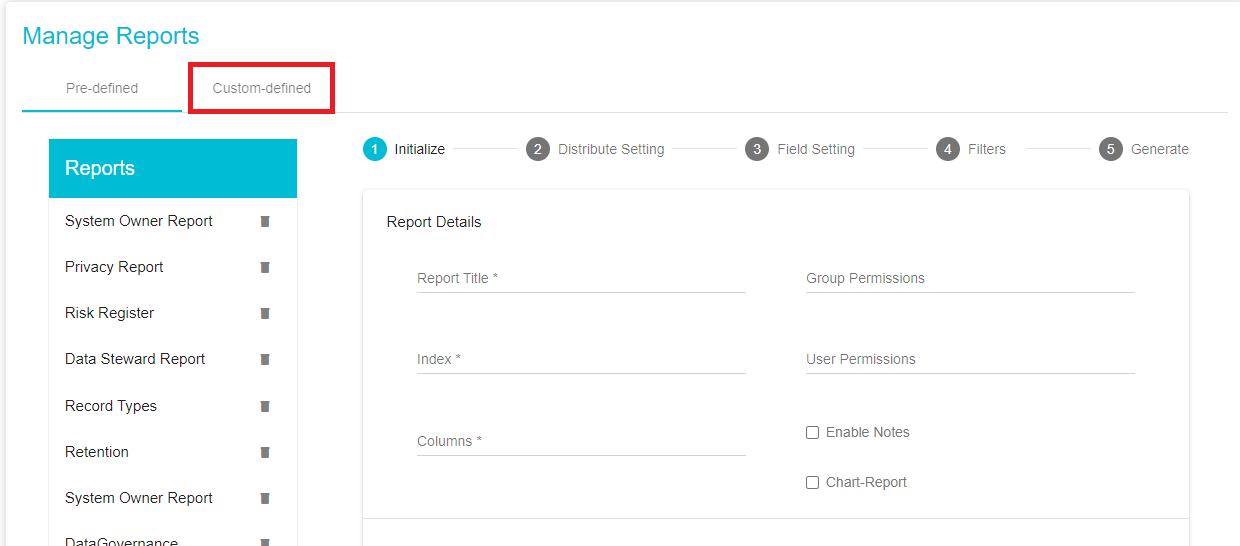
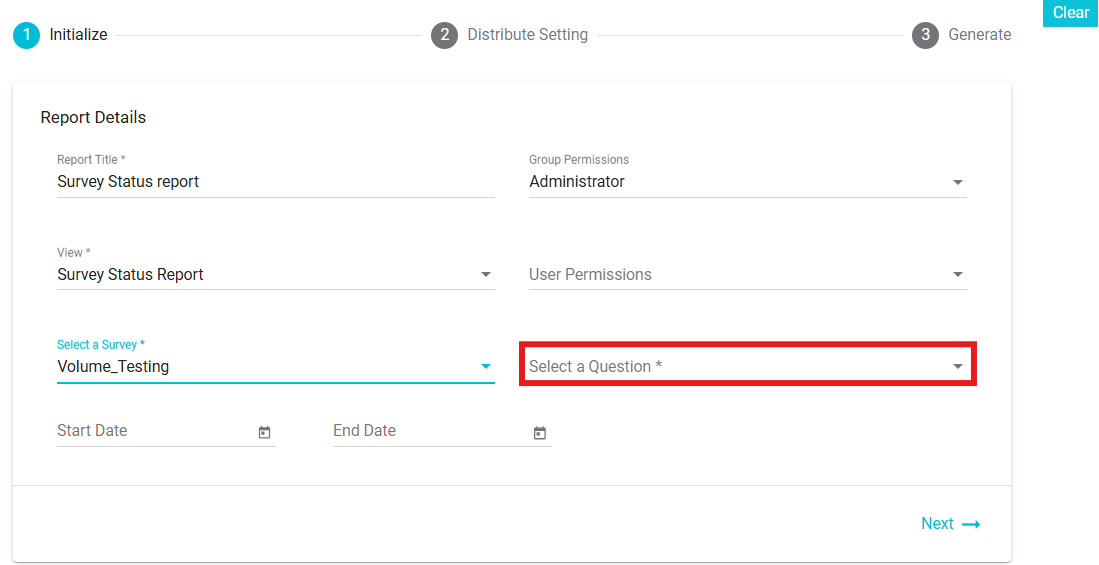
Once on the Custom-Defined tab, under the Initialize section add the report details.
The first section of the Custom Defined Tab is the Initialize Section.
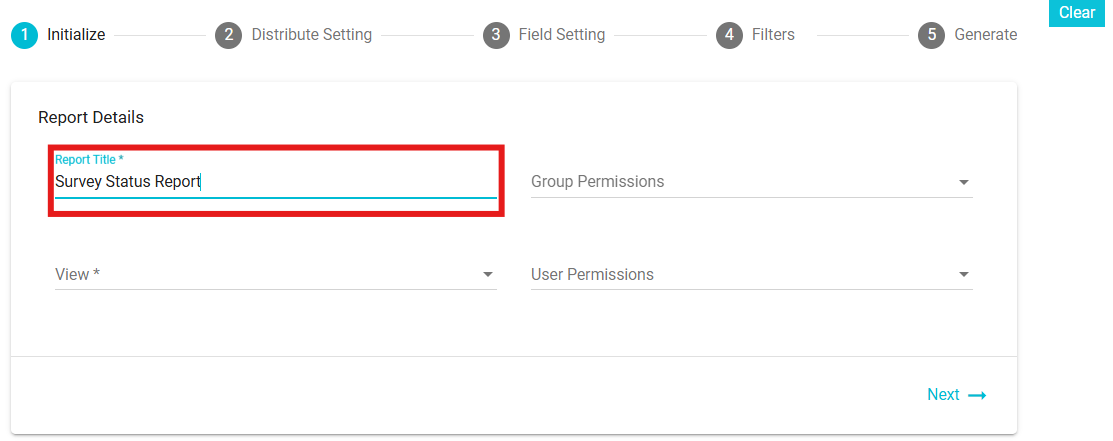
Report Title: add a custom Title to the report.
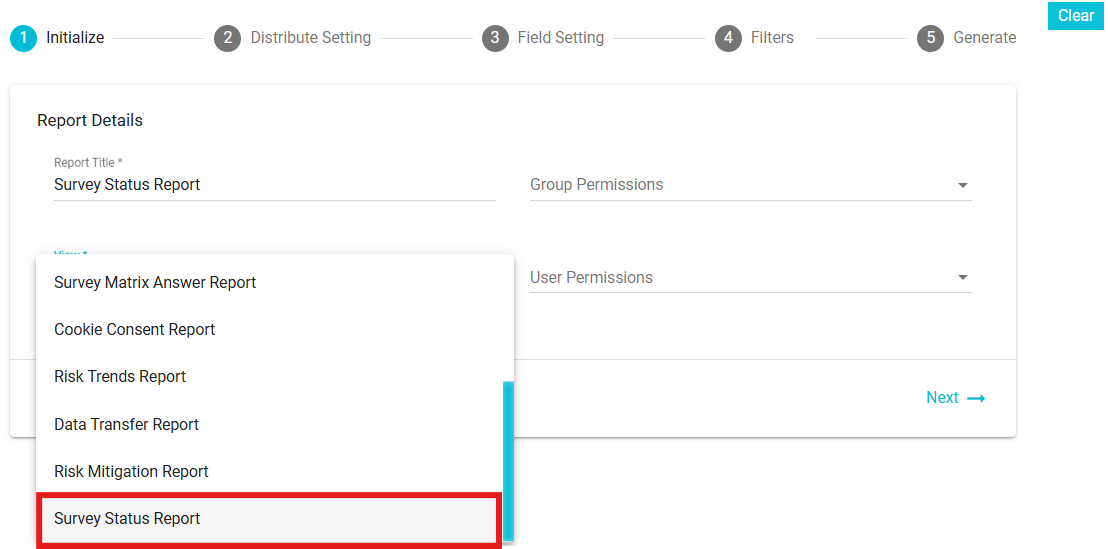
View: Select "Survey Status Report " from the drop-down menu .
Select a survey for the report from the dropdown.
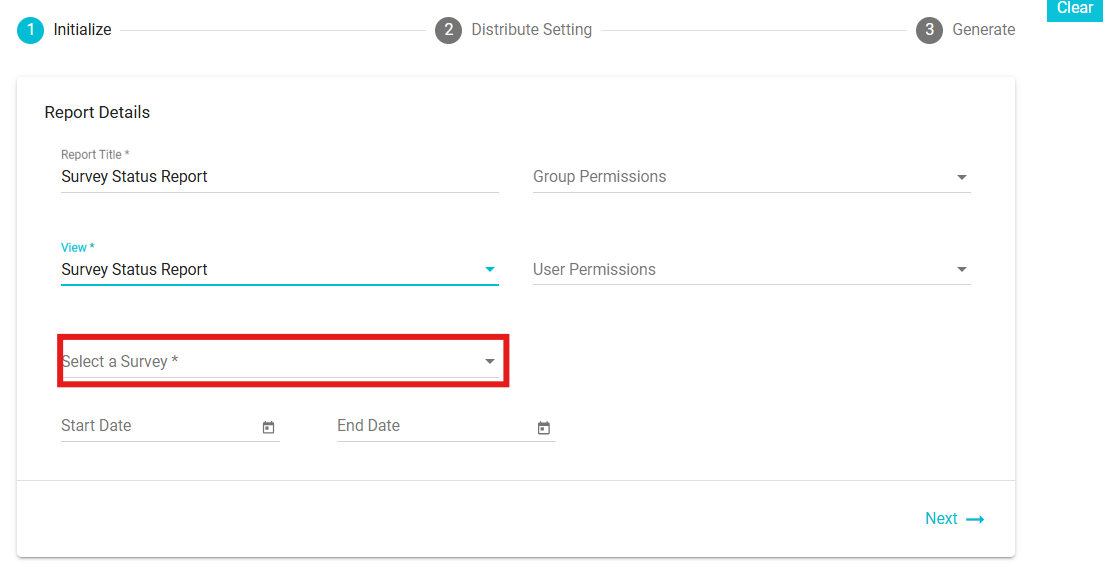
Group Permissions: From the drop-down menu, select the groups to which this Report should be made available. The report will be visible in the Reports module for the selected user groups.
After selecting a survey, a new field called "Select a question" will appear, allowing the user to choose a question from a dropdown list. Select a question related to department info.
User Permissions: If the admin prefers not to expose the report to the entire group, it can be published at the user level. From the drop-down menu, select the users to which this Report should be made available. The report will be visible in the Reports module for the selected users.
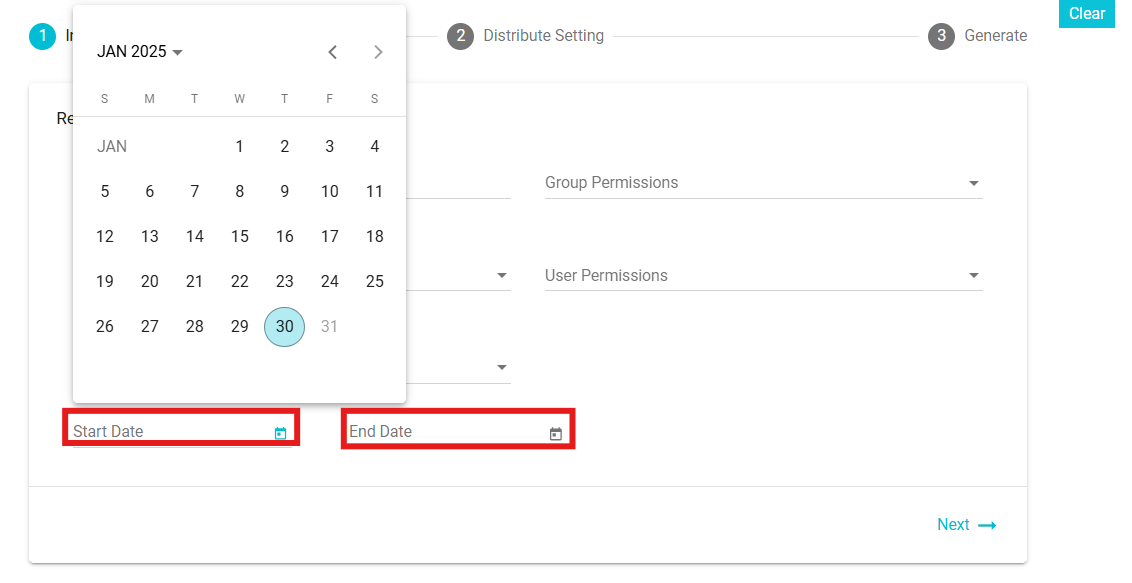
Start date and End date: The start date is when the report begins, and the end date is when it finishes. The report interval defines the time period for which data is displayed, allowing users to view reports on a weekly or monthly basis.
- Next move to the Distribute Settings section
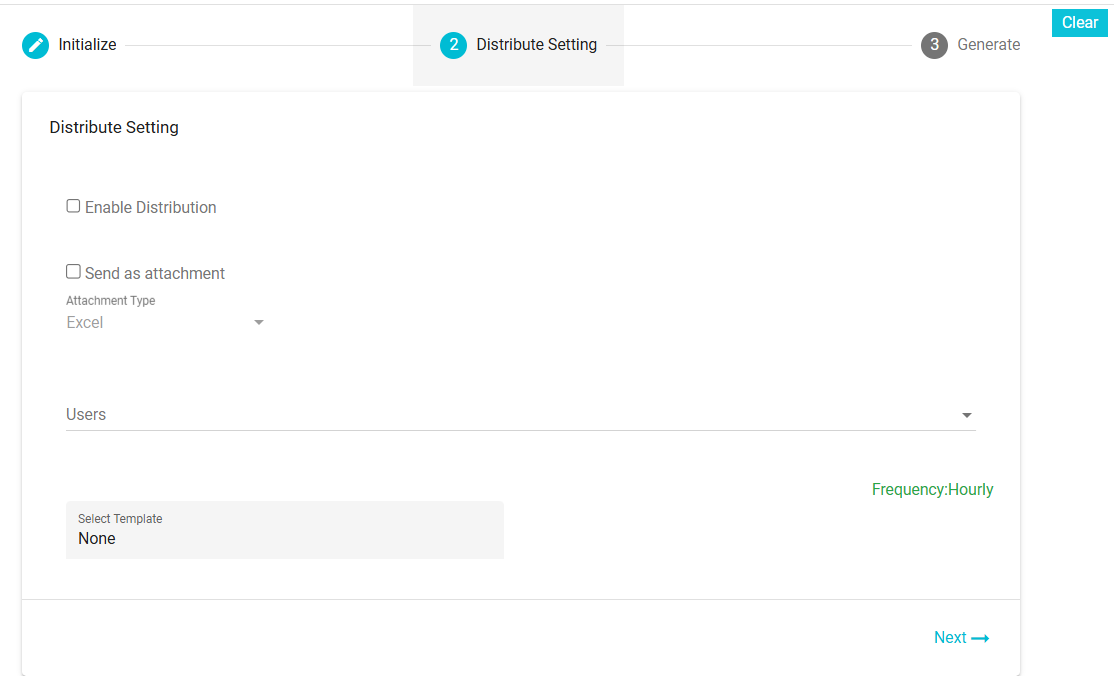
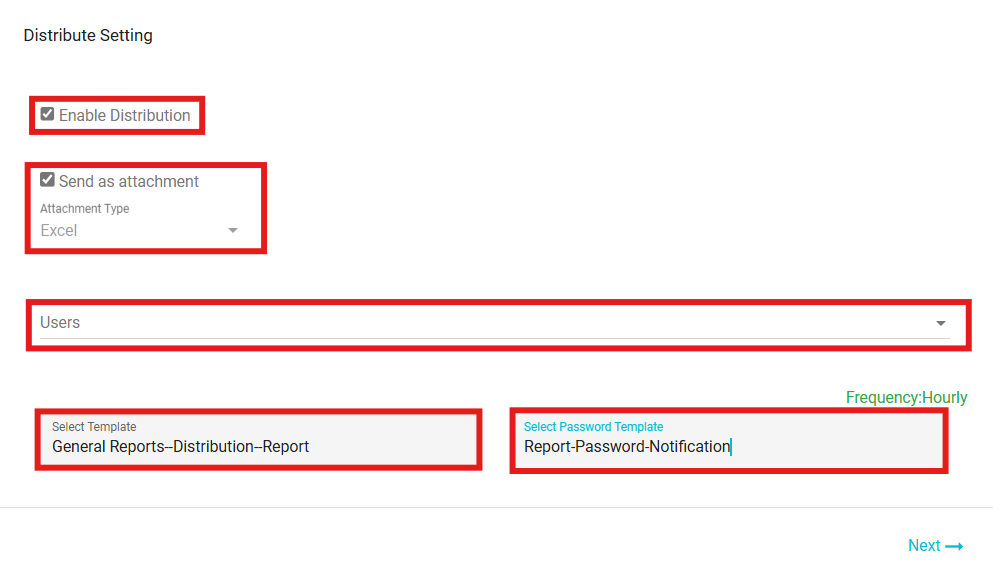
Enable Distribution: Check this box to automate the distribution. The report will be sent automatically to the selected users. The frequency will be determined based on the configured email template(i.e. daily, weekly, monthly or yearly).
Users: Select the users to whom the report should be sent. Users can be either single or multiple.
Send as an Attachment: Enable this checkbox if you want to send the report as an attachment in the email.
Attachment Types: Select the format of the attachment from the available options: Excel.
Select Template: Select the email template here. The templates here are defined in the Configure Email module. While configuring the email, the frequency with which it should be sent is also selected and the same is applied here, depending on the template selected. Different templates have different frequencies. To configure an email template for a report, you need to define templates based on specific event types. These event types determine the templates available, which are then displayed on the Distribution screen for selection.
For Example: General Reports - Distribution - Report: Used to configure and distribute general reports to selected users or groups. Report - Password - Notification: Sends notifications related to report passwords, ensuring secure access to the distributed reports. If the frequency has not been configured, the frequency field here will not be visible.
Select Password Template: Choose the email template for sharing the password required to access the report attachment.
 8. Finally move to the Generate Section
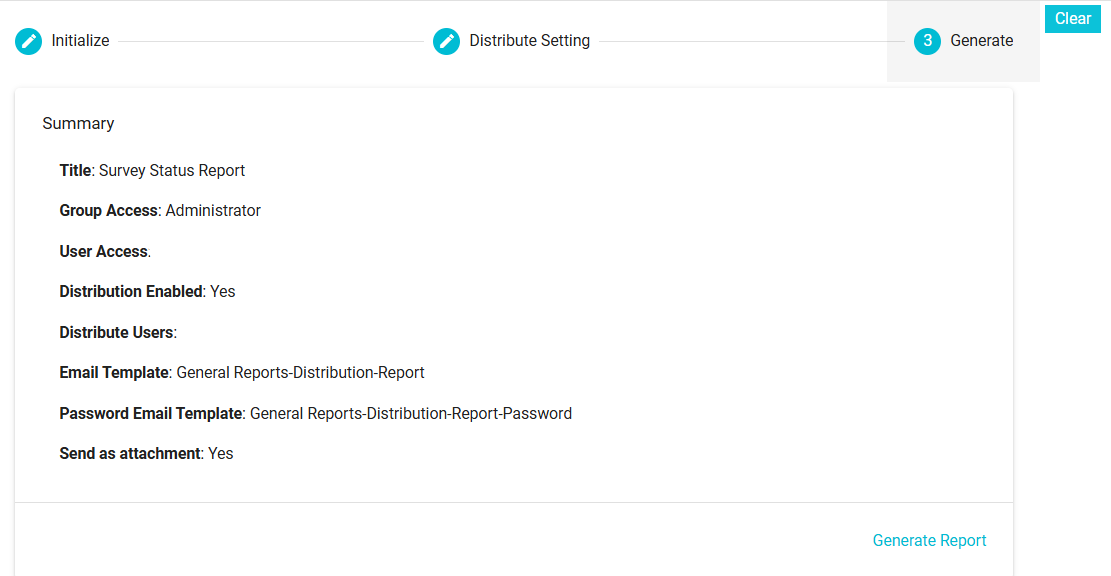 On this section, you can see the summary of the configuration for the report that are about to generate. Changes can be made by going back to the sections of your choice and making the required changes.
Finally, on clicking Generate Report, the configuration will be saved, the report will be available in the Reports Module for those users and groups with the permission, and the users selected will receive a copy of the report on their email.
On this section, you can see the summary of the configuration for the report that are about to generate. Changes can be made by going back to the sections of your choice and making the required changes.
Finally, on clicking Generate Report, the configuration will be saved, the report will be available in the Reports Module for those users and groups with the permission, and the users selected will receive a copy of the report on their email.
- If you decide to discard the configuration for the report, you can click the
 button.
To view the generated survey status report, follow these steps:
Click on Reports from the hamburger menu.
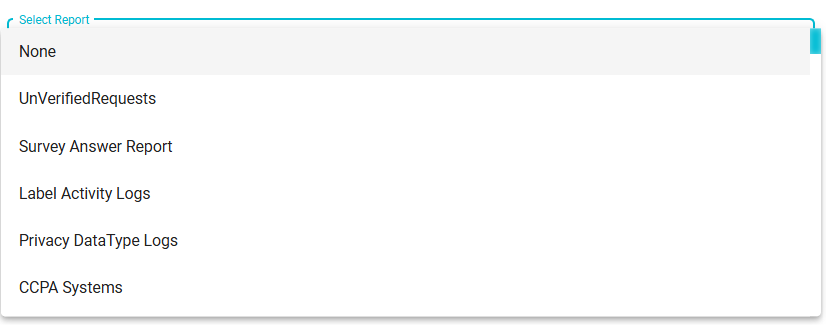
From the Select report drop-down, click on the report you wish to view.
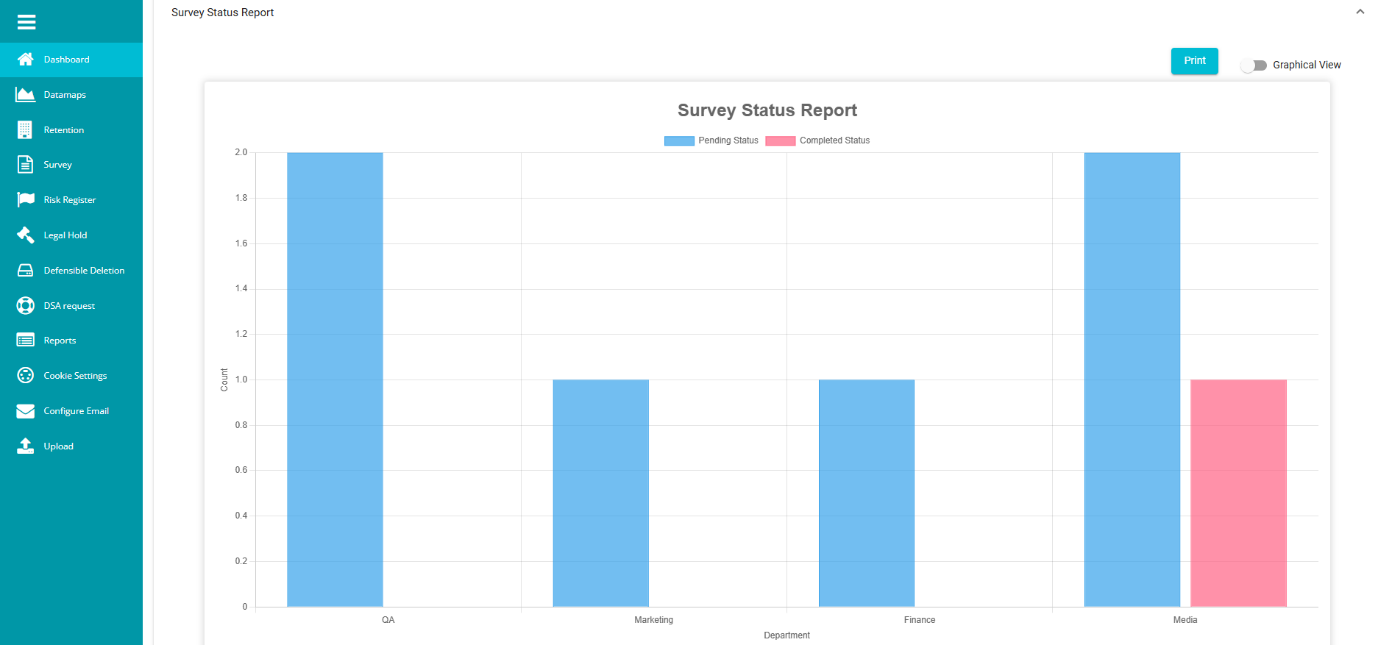
By default, the report is displayed in a graphical view.
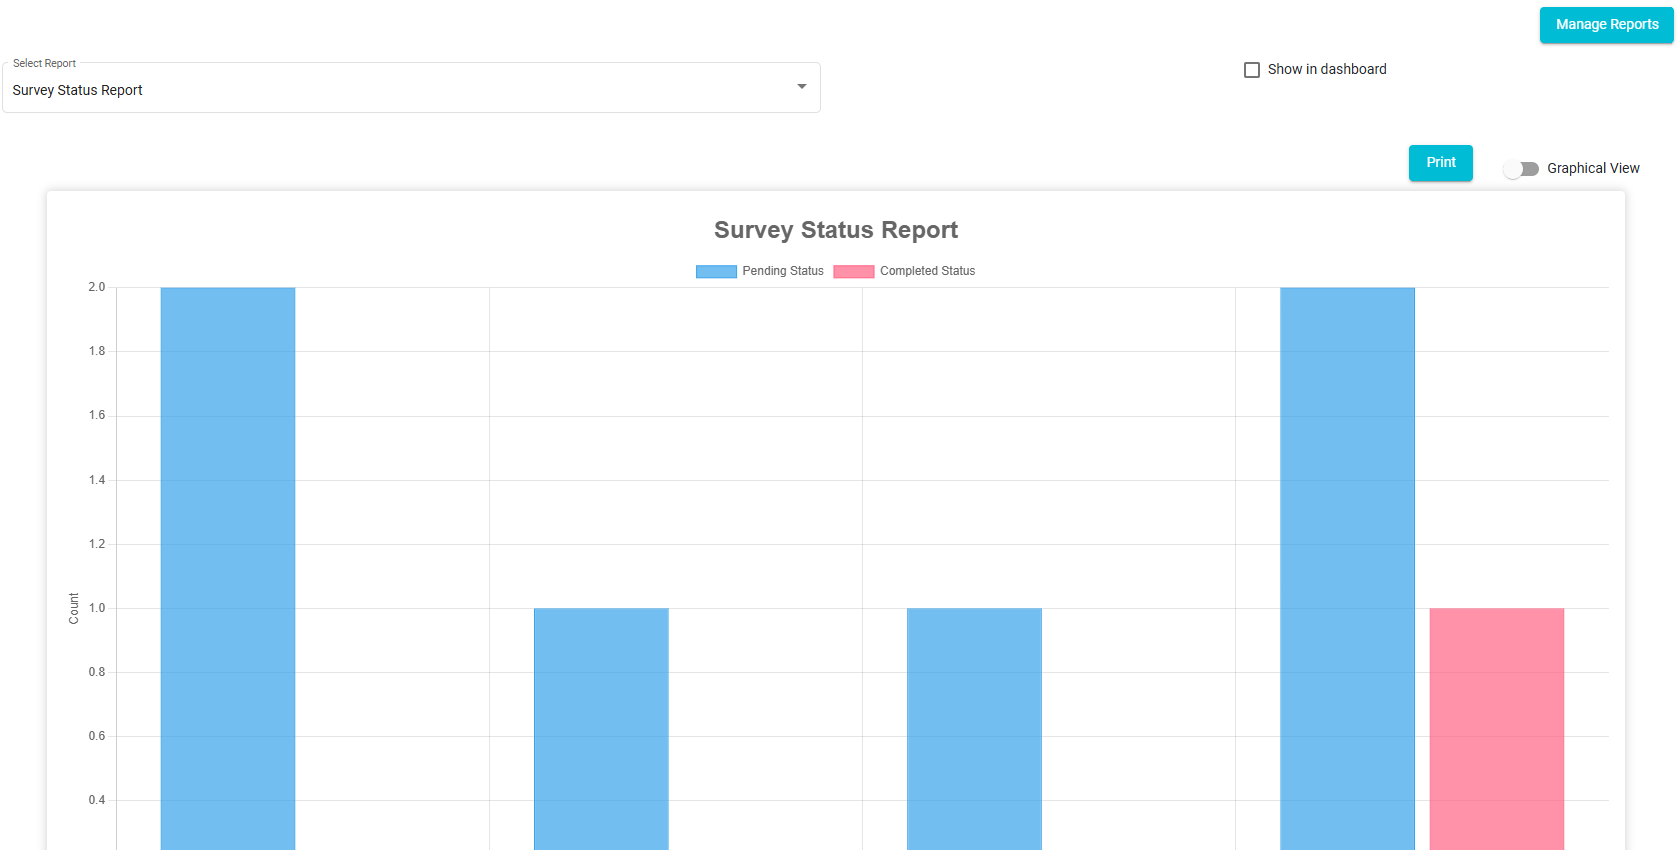
Click on the
 button to save the graph as pdf.
Turn on the toggle
 switch to view the report in grid view.
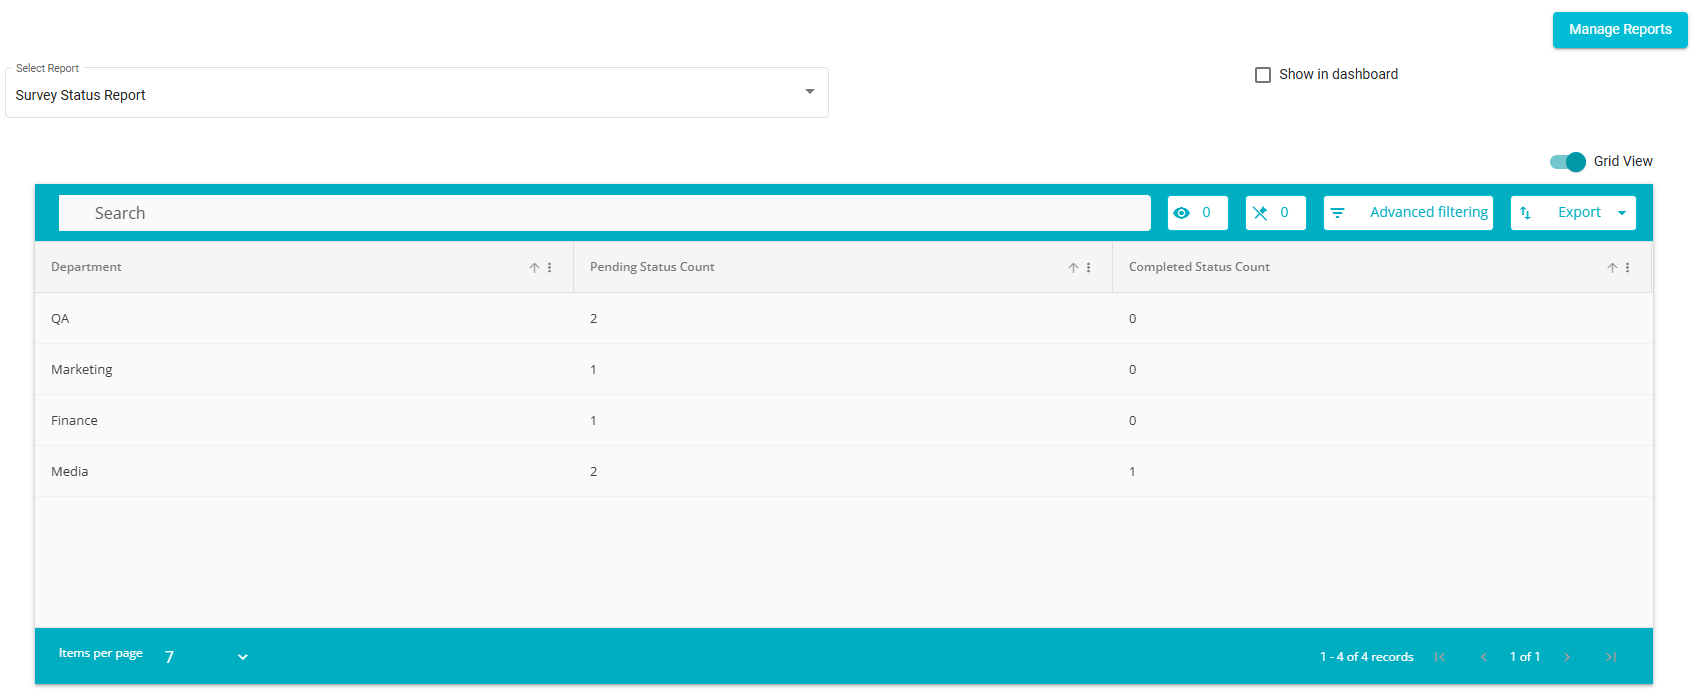
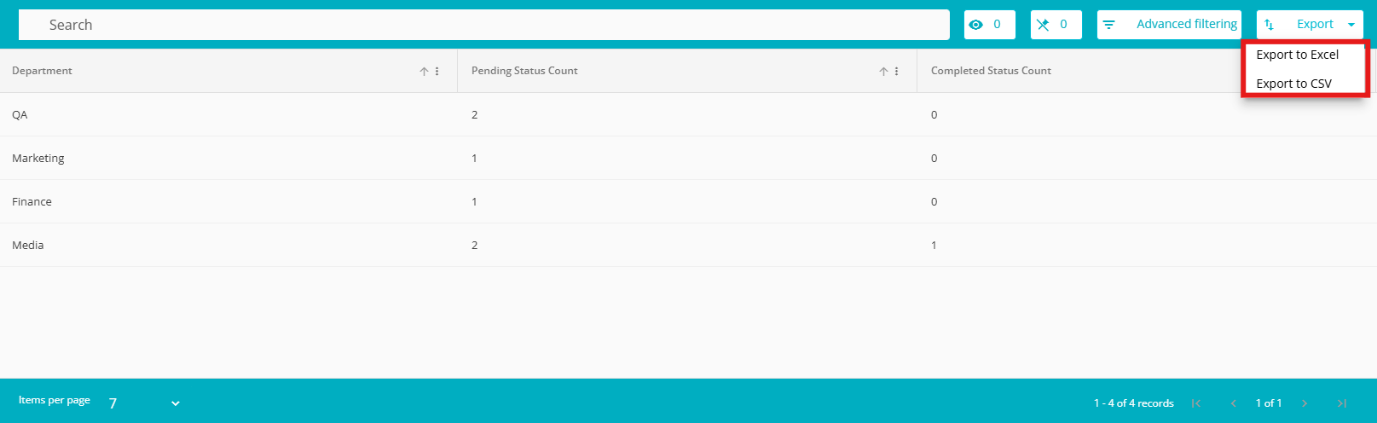
Note: The status (Pending or Completed) is determined using the "Survey Answered On" date.
The tabular view can be exported in either Excel or CSV format for easy data access and analysis.
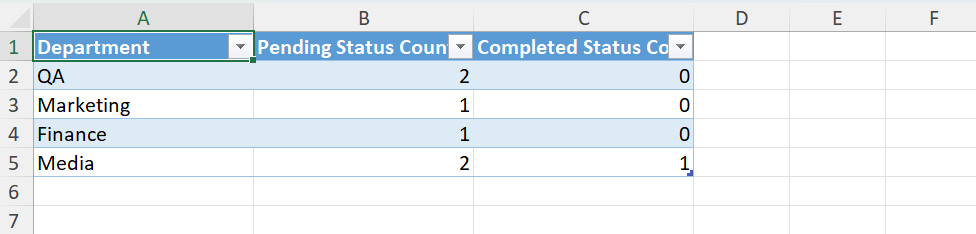
When the tabular format is exported in Excel, it maintains a structured layout.
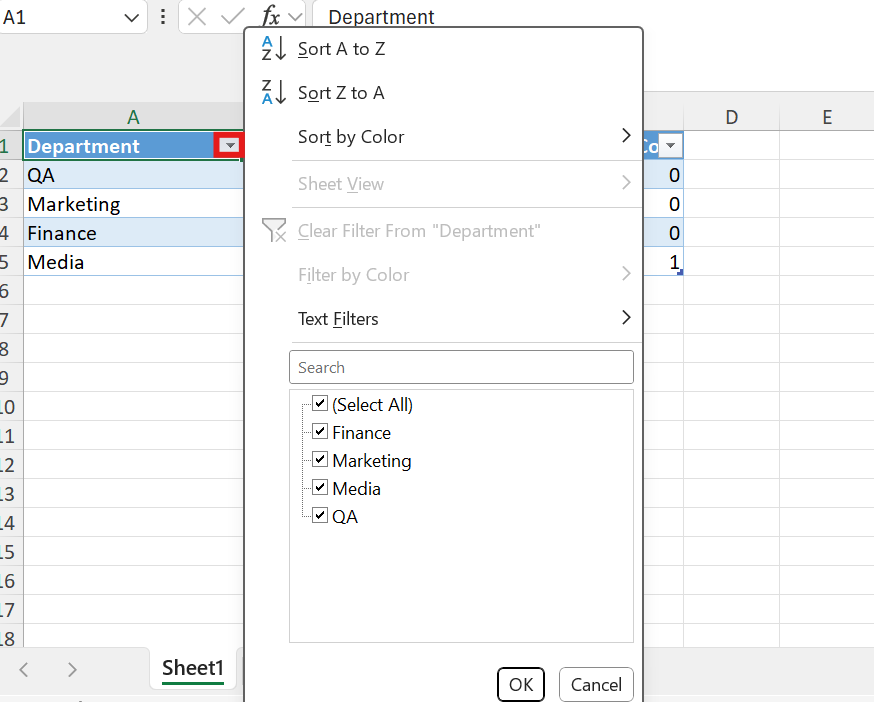
The user can further filter the data based on their requirements by clicking the button next to the field name.
Check the "Show in Dashboard" box to display the report on the main dashboard.
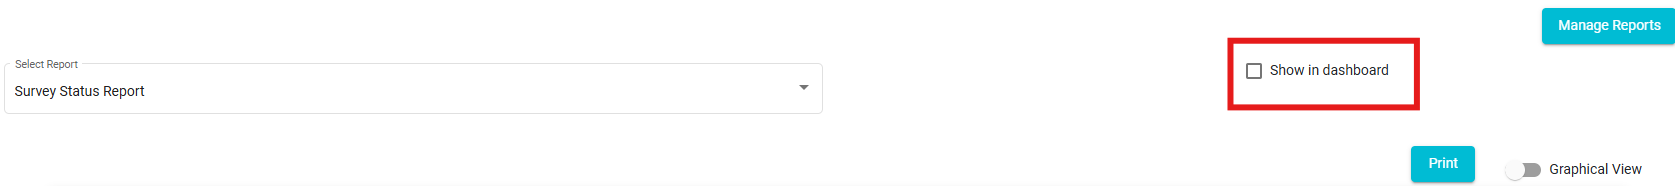
The report appears on the main dashboard.
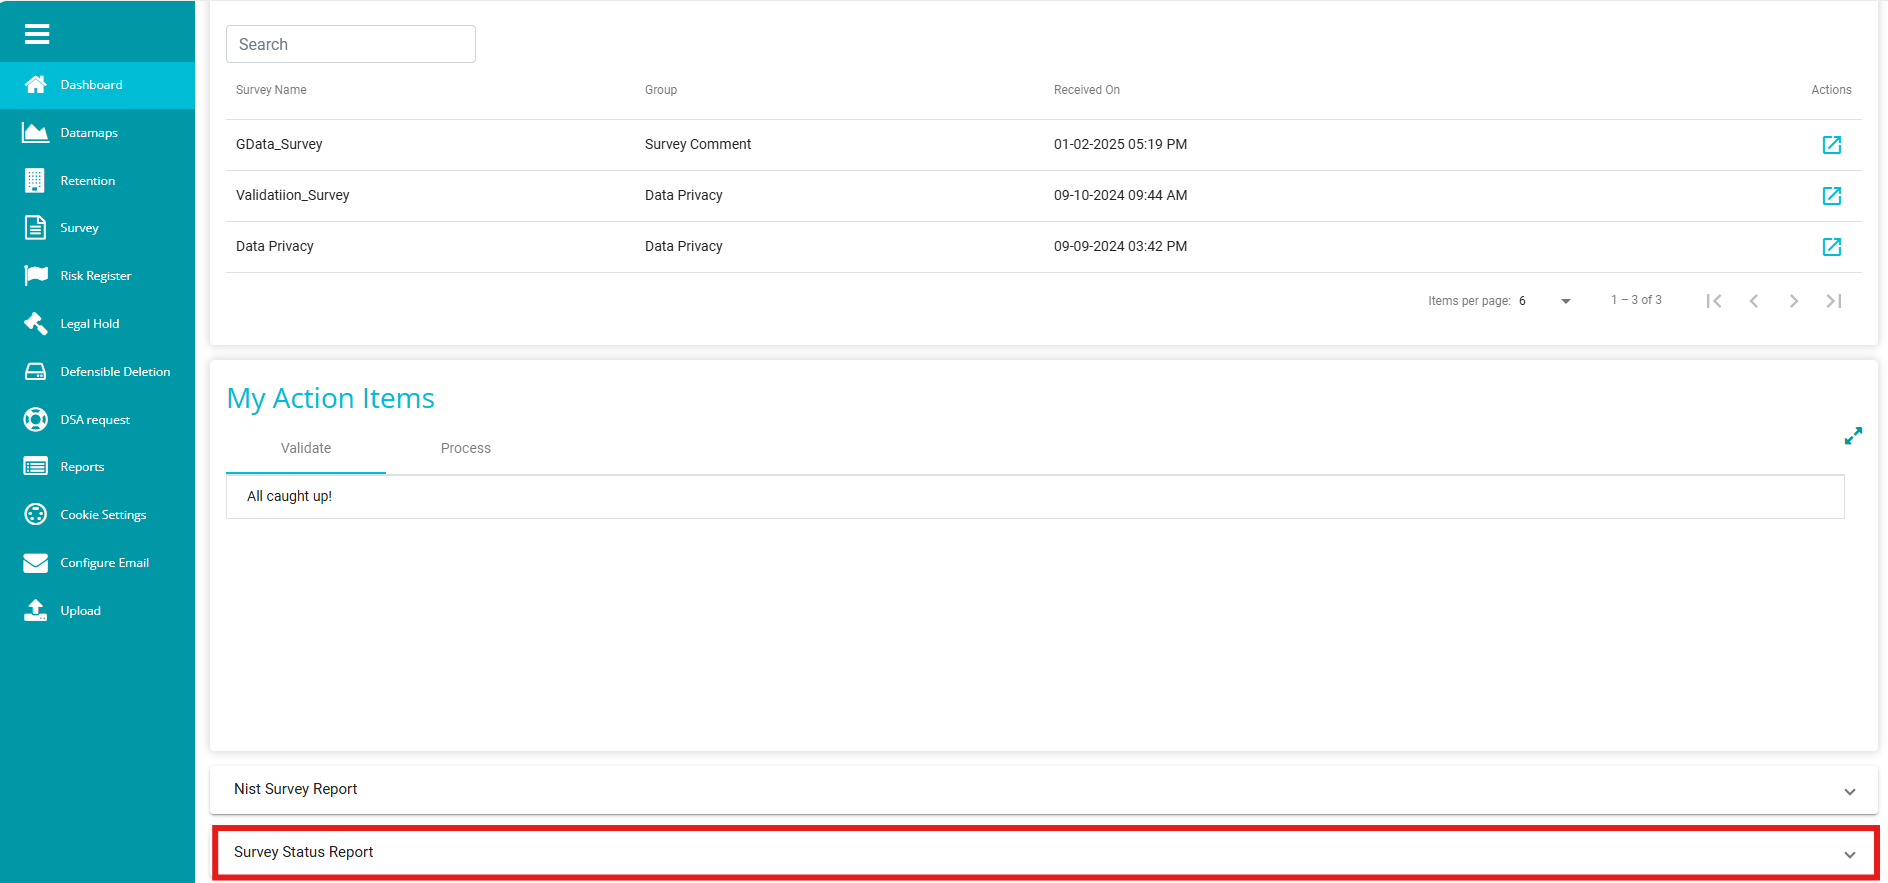
Click on the report to view it directly on the dashboard instead of navigating to the Reports module.